We have all heard the saying, “Don’t just work IN your business; you need to invest time working ON the business.” As the new year begins, it’s time to work ON the business to plan for the year. In this article, we will outline some things including creating a budget and CapEx plan to help you plan for success in 2025 and beyond.
In preparation for this exercise, we suggest joining an industry performance group to get access to current benchmarked KPIs to better prepare you to build a budget. These groups provide a networking opportunity to learn from others who have been successful and have tried the process improvements necessary to achieve best-in-class performance.
As you start the budget process, you will first want to determine which members of your staff (and advisory group) you want to include in this budgeting process. Then, you may want to invest time during the meeting reviewing how an income statement and cash flow is best understood so that everyone understands the KPIs you want to focus on. Remember the “Rule of Three (focus areas)” and focus on one (lead one project at a time). Let’s get started budgeting!
Completing the Budget
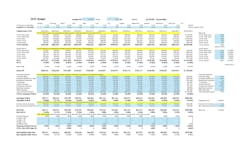
Start by creating a spreadsheet like the one below to enter your historical values for each of the KPIs and then invest the time to adjust as necessary to follow all the steps described in this article. Remember, budgeters think like economists and round numbers, so don’t fret the decimal points. You're looking for areas of focus. NOTE: Blue cells are where you enter the data.
Projecting Sales
First, project your annual sales by taking the number of vehicles repaired per year times the average RO # (Figure 1). Many successful companies strive to grow 10% per year, which represents 3% inflation (average RO growth) and 7% real growth (in number of vehicles repaired).
Next, we spread that projected annualized sales over the 12 months. To do this, we look at what percentage of the annual total sales we closed each month of the previous year or years. Then, distribute the annual goal via 12 monthly goals), considering seasonality. NOTE: These values need to add up to 100% of the projected sales.
Sales Sourcing
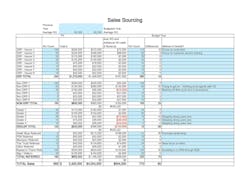
Once you set an overall sales goal, it is helpful to look at your referral or sales sources and project with whom you expect to grow the number of repairs and with whom you might back off a bit (due to profitability or service requirements) and then create a formal marketing plan with a projected dollar spend to attract the work you have projected per source (See Figure 2).
(Figure 2)
Projecting Sales Mix
Next on the budget sheet (Figure 1), enter your current or targeted per department sales mix. Your strategy to either focus on selling more repairs (versus replacing parts) will depend upon whether your shop has production capacity or has backlog over two months. We suggest shops with less than six weeks of backlog continue to repair to sell more labor to optimize higher labor gross margins and if you’re a DRP-oriented shop, your scorecard results should be better.
Projecting Gross Profit or Vehicle Related Costs
Next, go to the gross profit % section (Figure 1) and enter historical or projected values. When it comes to gross margin, you want to look at your weighted gross profit overall – we often use 45-50% overall gross profit as a target. Play around with the sales mix and your per departmental gross profit to achieve the optimal gross profit percentage. Then, the hard part begins, implementing the process improvements to achieve these results. Don’t just assume these changes can be easily made; engage your staff to gain buy-in for the process improvements necessary to achieve the improved results.
Staffing Planning
As you evaluate your sales, you need to determine the (journeyman to apprentice or office support) staffing plan for the next year to achieve the sales and GP % results projected. If you need to attract new staff, you may need to ask yourself, “Am I the employer of choice?” and, “Do we have a positive culture to retain our staff?” Therefore, we need to budget education in your overhead budget for solid hiring, training and development costs, and incentives for our current staff to retain them.
Projecting Overhead
Next you will want to look in the budget (Figure 1) and review your current overhead expenses as a % of sales, and either enter that percentage or adjust by a percentage to take advantage of improved projected sales. Remember, overhead expenses are all expenses NOT directly related to a specific vehicle. Here is an example…
IT expense of $30,000 / $3,000,000 total sales = 1% of sales if sales grow total sales to $4,000,000 (assuming you don’t need more “seats”), this overhead expense is reduced to .75% and the result is .25% more net!
Look closely at the General Journal at month/ year-end to see where you’re investing your overhead and consider plans to keep these expenses at or below 30-32% of Sales. Again, involve the staff to help you get ideas on where to possibly invest more wisely or save money.
Projecting Operating / Net Profits
Next look at the bottom of the budget sheet (Figure 1) to see if we have achieved the operating profit target we have set after we have grown sales, achieved the sales mix planned, optimized GP %, and optimized overhead expenses. Now is the time to see to what degree we have improved the operating and net profit with a target of 15-20%+.
Fillable Excel Document for CapEx Planning
Capital Expenditure Planning (CapEx)
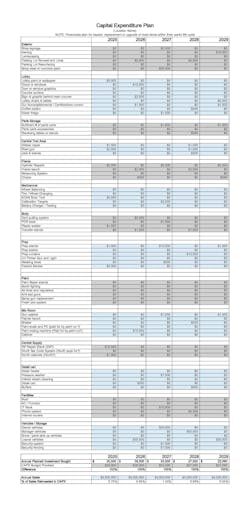
We have included a sample Capital Expenditure plan, and you can download a fillable Excel document for CapEx planning.
While some of these maintenance, facilities or capital expenses can be budgeted as expenses, it's valuable to look at a CapEx planning tool like the one shown to plan for these expenses, replacements or upgrades (especially related to OEM procedures).
Further, you need to plan for building maintenance on the signage, awning, lot, roofs, interior paint, lighting, pre-deck, booth, HVAC, and so much more. Planning to gradually replace these things in a logical timeline can prevent surprises to your cash flow. This plan needs to be refreshed annually, and cash allocated, and expense projected in overhead expenses.
NOTE: We intentionally separated rent from the other overhead to allow for benchmarking which is not clouded by tax avoidance strategies relative to rent and vehicle/equipment companies with different fiscal periods.
Projecting Growth in Cash Flow
Too many inexperienced financial managers forget that net income is NOT cash flow. Cash flow needs to consider principal on loans or payments towards capital leases.
Near the bottom of the budget sheet (Figure 1), we estimate cash flow by considering net income, principle payments, limitation of AR, managing AP, and limiting WIP and physical inventory has a direct impact on the cash flow which can be used to pay for facility updates, expansion, setting up a PDR, glass, mechanical / ADAS business or even acquisition and short term can be invested in money markets while the business finds the best ways to invest these funds.
Steps to Implement the Plan
Once the plan is refined and distributed, you want to gamify the results, by putting up scoreboards (sales $, GP %, cycle time, closing ratio, etc...) and meeting with the staff to perform a pulse check on the 10th of the month, the 20th of the month, and last day of the month to make sure you are on track towards the month-end goal. We will do an article on this topic at a later date.
Month-end Review
Finally, we suggest you (and senior leaders) invest one hour per month reviewing your financials and comparing them to this monthly budget. The good news is that many accounting systems allow you to enter these budget values and the accounting system will create a budget variance report to focus your improvement efforts.
During this review, you will certainly also want to review gross profit reports (look at the notes screen for any ROs below 45% to see why), cycle time reports, sales sourcing, closing ratio, employee efficiency reports, and others...
Further, don’t forget to review your balance sheet to see the impact WIP, AR, AP and other things are affecting your cash flow to ensure you are on track to achieve the growth in cash flow you projected.
Good luck with your planning for 2025!
About the Author
Steve Trapp
Steve Trapp is an internationally known consultant and speaker. His family operates a collision repair center in Wisconsin. He earned a degree in economics education and a minor in accounting from the University of Wisconsin.
After college, he worked for 3M in sales and marketing roles with the innovative 3M ARM$ training and software sales. He worked as a consultant for AutocheX doing financial consulting for a few years before joining AkzoNobel, where he started the industry’s first value-added program. While there, he started the industry’s first paint company-sponsored 20 groups and wrote numerous training programs with third-party experts on finance, marketing, selling, leadership, and other topics.
He later joined DuPont/Axalta, where he worked with Mike Anderson to manage their 20 groups and industry seminars. While at Axalta, he managed the North American Strategic Accounts SAM team and later the entire EMEA Strategic Accounts team. He followed that as senior consultant for LEAP, a global consulting firm that has presented in 10 countries and now again works for a major paint company.


